
Browse all docs
Setup and admin
Insights
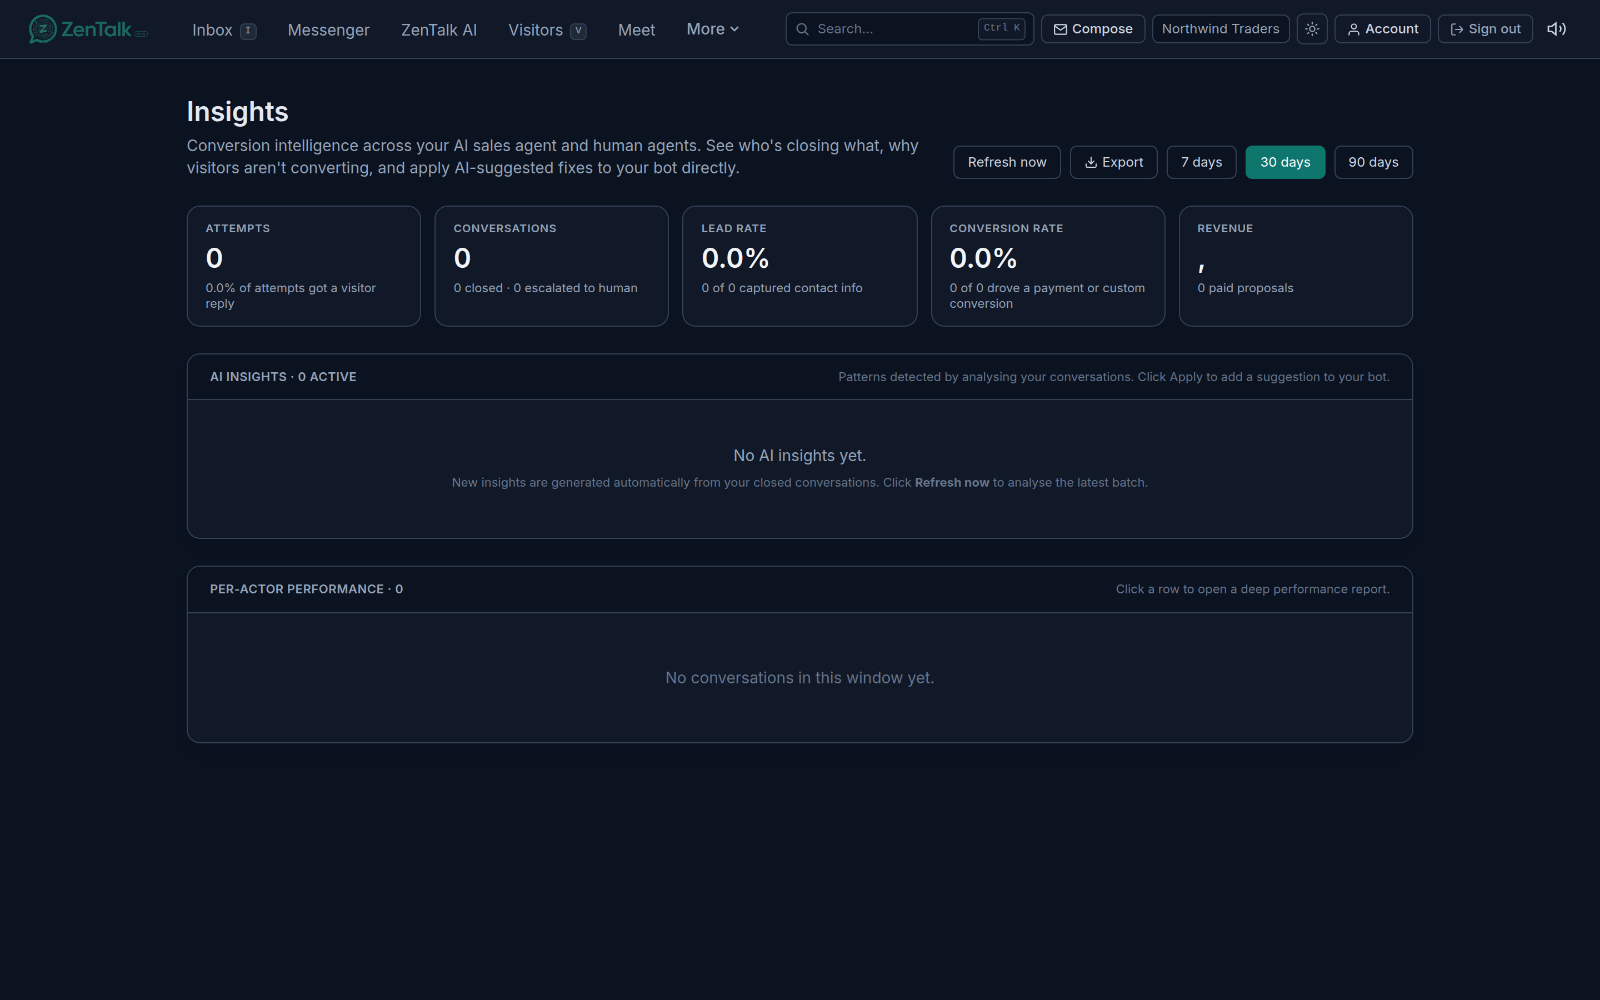
Insights is your conversion and conversation intelligence tab. It reads your closed chats and tells you who is closing what, why visitors are not converting, and what to change about your AI sales agent to do better.
What the Insights tab is for
Insights turns raw conversations into a scorecard. It compares your AI sales bot against your human agents, ranks who is performing, and surfaces AI-detected patterns behind your wins and losses. Where most of the tab reports on what already happened, the AI insights section is actionable: you can apply a suggested fix straight to your bot from here.
The Insights tab requires the INSIGHTS module to be enabled on your plan. If you do not see it in the top navigation, the module is not turned on for your workspace.
Choosing your window
The Overview reads over a rolling window. Use the day switcher in the top-right to move between 7 days, 30 days, and 90 days. Every metric, the per-actor table, and the deep scorecards all recompute against the window you pick. Thirty days is the default.
Two sub-tabs sit across the top when they apply: Overview(the conversion intelligence covered here) and Keyword Revenue P&L, which shows per-keyword ad spend against chats and leads. The Keyword tab only appears when at least one site has it enabled, and it carries its own date, site, and ad-network filters.
The headline metrics
The top of the Overview shows five cards for the whole workspace across your chosen window:
- Attempts - conversations your team or bot touched by sending at least one message, including ones the visitor never answered. The sub-line tells you what share of attempts got a visitor reply.
- Conversations - the attempts where the visitor actually responded. This is the denominator for the two rates below. The sub-line breaks out how many closed and how many were escalated to a human.
- Lead rate - the share of conversations where the visitor was identified by email, phone, or name, with the raw captured count alongside.
- Conversion rate - the share of conversations that drove a payment or a custom conversion event.
- Revenue - total collected in the window, shown per currency, with the count of paid orders.
Use the Export button next to the window switcher to download the current window as a CSV. It combines the headline numbers and the per-actor breakdown into one file, which is handy for a client or a review.
AI insights and how to act on them
Below the metrics is the AI insights feed. These are patterns the system finds by analyzing your conversations, each shown as a colored card with a title, a short explanation, and the number of conversations it affected. Card types include:
- Win pattern - something that repeatedly helped close.
- Loss pattern - something that repeatedly cost you the sale.
- Recurring topic - a subject that keeps coming up.
- Agent performance - a signal tied to a specific person.
- Operational - a process or coverage observation.
New cards are generated automatically from your closed conversations. If the feed looks stale or empty, click Refresh now to analyze the latest batch; a toast reports how many new conversations were analyzed and how many cards were generated. On each card you can clickShow conversations to see the evidence chats behind it, each linking straight into the dashboard.
When a card carries a suggested change, admins see an Apply to bot button. Applying it adds the suggestion to the AI sales agent's persona on every site that has a bot configured. You are asked to confirm first, and you can review or remove it later from Sites, AI sales agent. Cards you do not want can be sent away with Dismiss. Applied cards show a green Applied tag.
Per-actor performance
The per-actor table ranks everyone who handled chats in the window, with the AI sales bot listed alongside your human agents (the bot is tinted and tagged AI). Columns cover Attempts, Conversations, Leads, Lead rate, Converted, Conversion rate, and Revenue, plus a Notes column. Hover the column headers for the exact definition of each.
- A Top performer tag marks the strongest human agent. Ranking uses lead rate when no one is driving revenue yet, and switches to conversion rate once revenue is landing.
- Actors with fewer than three conversations are flagged as Sample too small for ranking, so a lucky single close does not top the board.
- For the bot, the Notes column shows how many chats it handed off to a human.
The deep scorecard
Click any row in the table to open that actor's full performance report inline below it. It fetches on demand and adds detail you cannot see from the row alone.
Across the top are six metric cards: Attempts, Conversations, Lead rate, Conversion rate, First response time, and rating (CSAT for an agent, AI rating for the bot). For a human agent, each metric carries a vs workspace median sub-line tinted green when they beat the median and red when they trail it, so you can see at a glance who is above or below par.
Beneath the cards are three frequency lists that read the AI-derived signals:
- Top topics handled - the subjects this actor deals with most.
- What worked / Win patterns - the recurring reasons this actor closes. Lean into these.
- What did not / Where the bot lost - the failure factors: the recurring reasons chats stalled or went nowhere. These are your fix list.
For the bot, an extra Recurring visitor objections list shows the pushback it keeps hearing. Any list can read "no clear pattern yet" until there are enough conversations for the AI to detect a reliable signal, so give a thin window time to fill in.
At the bottom are three sample lists of real conversations, chosen so you can go read them yourself: Recent wins (paid or converted), Recent leads captured (visitor identified, a success even with no revenue), and Recent losses (the visitor engaged but neither converted nor shared contact info). Empty greeting-into-the-void chats are left out on purpose. Each links into the dashboard so you can study exactly what happened.
A weekly review workflow
- Pick a window that matches your reporting cadence, usually 30 days.
- Scan the five headline cards for the trend in lead rate, conversion, and revenue.
- Click Refresh now, then read the new AI insight cards top to bottom.
- Open the evidence chats on any loss pattern to confirm it is real before acting.
- Apply the win patterns and clear fixes to your bot; dismiss the noise.
- Open the bot's scorecard and each agent's scorecard, and coach on the failure factors and objections you find there.
Who can do what
Everyone with access to the tab can read the metrics, cards, tables, and scorecards. Owners, admins, marketeers, and super admins can additionally click Refresh now, Apply to bot, and Dismiss. Agents see the same intelligence but cannot change the bot from here.
For the broader traffic and workspace trends, see Analytics. To dig into the CSAT scores that feed the quality metric here, see Ratings.