
Browse all docs
Setup and admin
Analytics
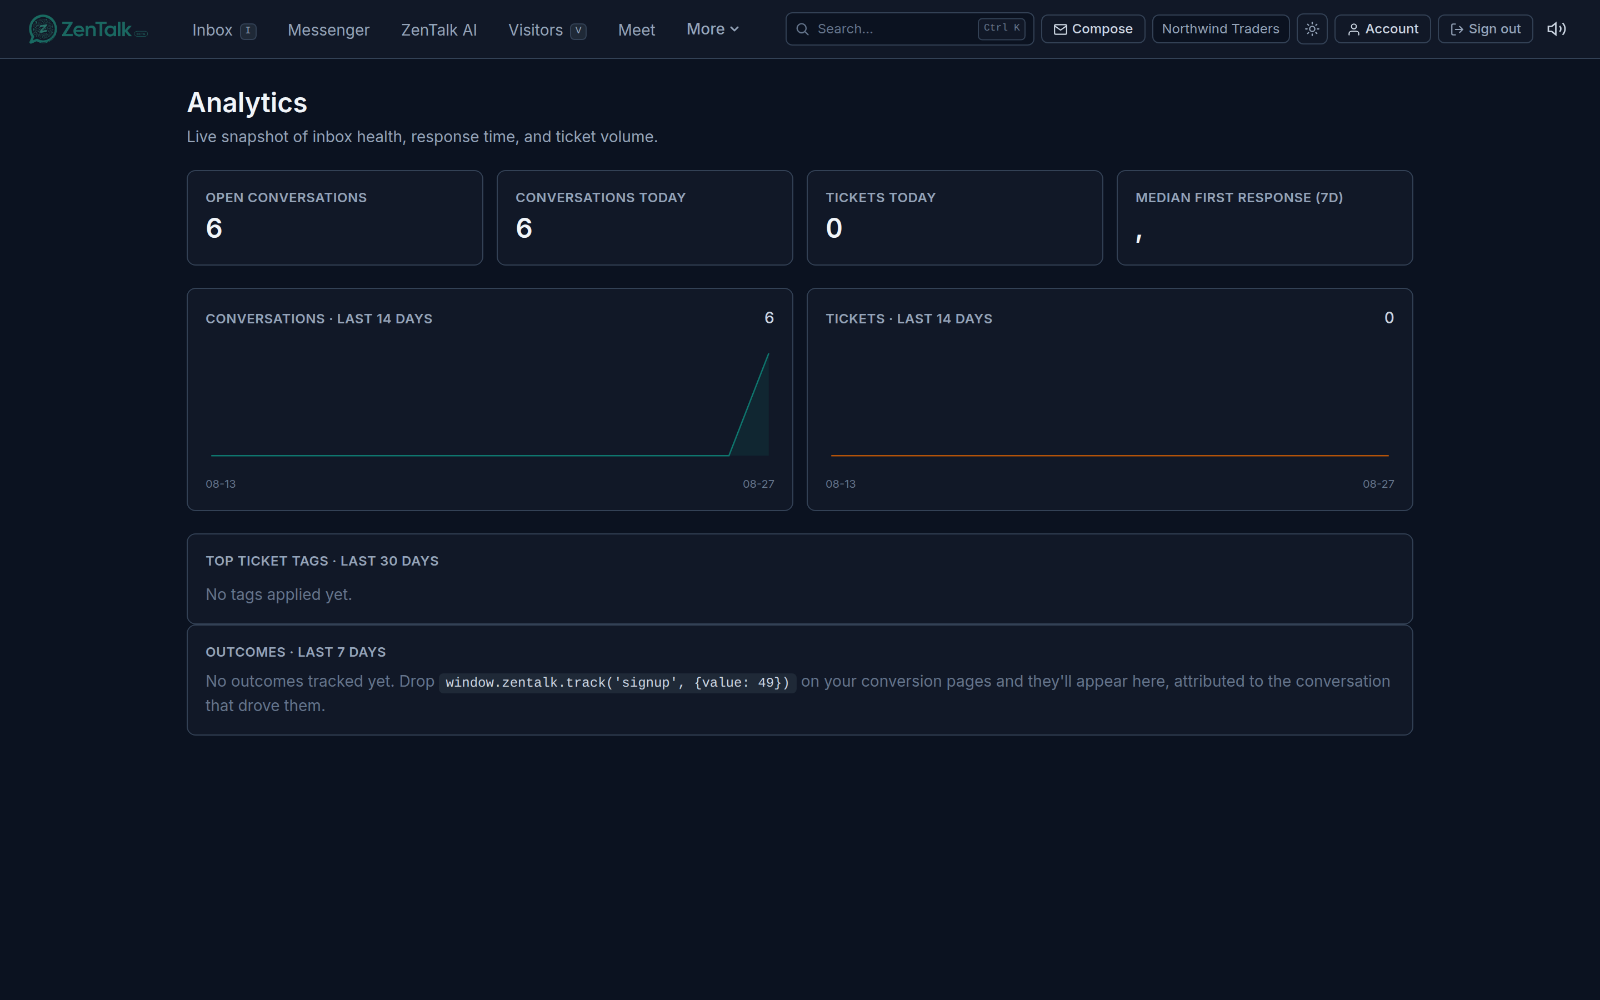
The Analytics tab is a live snapshot of how your team is handling conversations right now: how busy the inbox is, how fast you answer, how many tickets are coming in, and which chats actually drove revenue.
What this tab is for
Analytics answers the operational questions about your support and sales work: How much are people chatting with us? Are we replying fast enough? What are visitors writing in about? And did any of those chats lead to a sale? It reads straight from your workspace activity, so the numbers update as your team works. There is nothing to set up.
Open it from the top navigation of the agent dashboard by clickingAnalytics. The page loads a single overview for your whole workspace. It is a read-only report, so anyone signed in to the workspace can view it.
The headline numbers
At the top of the page are four stat cards that give you the state of the inbox at a glance:
- Open conversations: how many chats are currently open and unresolved across the workspace. This is your live backlog.
- Conversations today: the number of conversations started so far today.
- Tickets today: the number of tickets created so far today.
- Median first response (7d): your typical time to first reply over the last 7 days. It is shown in seconds, minutes, or hours (for example 45s, 3m, or 1.2h). If there is no data yet for the window, this card is blank.
The trend charts
Below the stat cards are two line charts that show volume over the last 14 days:
- Conversations, last 14 days: a daily line of how many conversations started each day, with the 14-day total shown in the top right of the card.
- Tickets, last 14 days: the same daily view for tickets created, again with the running total in the corner.
Each chart labels the start and end dates of the window along the bottom. Read them together to spot patterns: a spike in conversations that is not matched by tickets usually means questions are being resolved in chat, while the two rising together points to real demand or a recurring issue worth a canned response.
Top ticket tags
The Top ticket tags, last 30 days section lists the tags applied most often to tickets over the past month, each shown as a pill with its count. This tells you what people keep writing in about, so you can prioritize documentation, fixes, or new canned responses. If no tags have been applied yet, the section shows a short empty message instead.
Outcomes: which chats made money
The Outcomes section at the bottom connects conversations to real conversions. When a visitor completes an action on your site, that event is attributed back to the visitor's most recent chat (within the last 7 days), so you can see which conversations actually drove revenue. The window length is shown in the section header.
When there is outcome data, this section shows:
- Events and Value stat cards: the total number of tracked events and the total value, listed per currency.
- Top events: the most common event names with their counts, and total value where a value was recorded.
- Top agents: the agents whose chats are credited with the most attributed events and value. Outcomes from anonymous visitors do not roll up to a specific agent, so they are not counted here.
- Recent: a scrollable feed of the latest events, each showing the event name, its value, the visitor, the crediting agent, and how long ago it fired. Click Open chat on a row to jump straight to the conversation it is attributed to.
If no outcomes have been tracked yet, the section explains how to start: drop a small tracking call such as window.zentalk.track('signup', {value: 49}) on your conversion pages, and events will begin appearing here, attributed to the conversation that drove them. This section fails quietly, so if the data cannot load it simply hides rather than blocking the rest of the page.
Reading team performance
Use these numbers together rather than in isolation:
- Start with Open conversations to see the live backlog. A steadily growing backlog means new chats are arriving faster than the team is closing them.
- Check the Median first response (7d). If it is creeping up while conversation volume is flat, the team is stretched; if volume is also climbing on the 14-day chart, you likely need more coverage.
- Compare the Conversations and Ticketscharts to understand how much is resolved in chat versus escalated.
- Read Top ticket tags to see what is driving the volume, then use Top agents in Outcomes to see who is turning those chats into results.
Dates and site scope
Analytics reports on your entire workspace, covering all of its sites together, and each metric uses its own fixed time window: today for the daily counts, the last 7 days for median first response, the last 14 days for the trend charts, the last 30 days for top tags, and the labeled window for Outcomes. There are no date pickers or site filters to adjust on this page; the windows are set for you so the report always reflects a consistent, up-to-date view.
How this differs from Insights
Analytics and Insights answer different questions. Analytics is operational: counts, response times, ticket volume, tags, and revenue outcomes, all measured directly from your activity. Insights is AI-derived conversion intelligence: it reads your conversations to surface why deals are won or lost, what visitors are really asking for, and where the bot and team can improve. Reach for Analytics when you want to know how much and how fast; reach for Insights when you want to know why.
Related
To dig into the AI-derived conversion intelligence behind your numbers, see Insights. To measure how satisfied visitors are with each chat, see Ratings.